This paper originally appeared in Sound & Vibration Magazine, October 2012, pp. 10-13.
The accumulated damage that a product experiences on the field due to the variety of stresses placed upon it will eventually cause a failure in the product. These failure modes can be replicated in the laboratory using random vibration testing. During the past several years, the vibration industry has been introduced to Kurtosis Control – a new technique that brings about these failure modes in the laboratory in a more realistic and speedy fashion. The Fatigue Damage Spectrum (FDS) is an effective tool that can show the damage a product will experience at a particular frequency and the effect Kurtosis Control has on the random vibration test. Kurtosis Control is a more effective method than traditional random vibration tests because it brings products to failure more quickly. The Fatigue Damage Spectrum shows the increasing fatigue damage across all frequencies that accompany the increased kurtosis levels that cause the faster product failure. The FDS is another great tool that clearly illustrates the effectiveness of Kurtosis Control.
Introduction
One of the goals of random vibration testing is to bring a test item to failure in order to identify weaknesses in the product. Historically, random vibration controllers accomplished this goal by producing a power spectral density (PSD) that would expose the test item to the type of vibratory environment that the test item would experience in the real-world setting. This would involve exposing the test item to an “average acceleration” test profile over a large range of frequencies. In this way, the test item would experience the same kind of energy that it would in the field. Unfortunately, in order to provide this “average acceleration” the vibration controllers utilized a Gaussian distribution of data, allowing for only +/- 3 sigma peak accelerations. Consequently, the test item could be “under-tested” and require a long test time to find the failure. The test item could be “under-tested” because research has shown that real-world data often is “Non-Gaussian” in nature.10,11 Also, since the large peak accelerations that can be present in real-world data are “averaged” out by the Gaussian method, it will take longer to bring a test item to failure using such a method.10
An improved method of random vibration testing is Kurtosis Control. This innovative technique tests a product with Non-Gaussian distribution of data and includes the large peak accelerations, while maintaining the same energy and other test specifications. This helps make the random vibration test more realistic because it includes the kind of peak accelerations commonly found in the field. Furthermore, Kurtosis Control will bring a test item to failure more quickly than a Gaussian test because the Kurtosis Control technique includes the large peak accelerations that are known to cause the damage to the product.
A helpful tool that can be utilized to help a test engineer evaluate the effectiveness of Kurtosis Control is the Fatigue Damage Spectrum. A Fatigue Damage Spectrum (FDS) is a plot of the fatigue experienced by the product during a range of frequencies. Generally, the low frequency content of a test contains the higher fatigue damage (See figure 1).
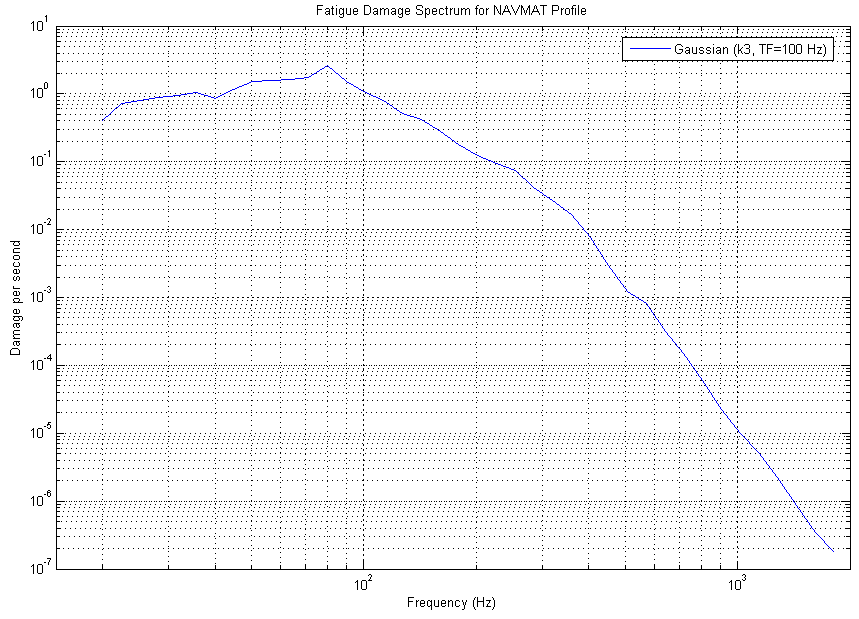
Figure 1: Fatigue Damage Spectrum for a simulated NAVMAT profile at K=3 (Gaussian)
FDS plots are based upon the principle of fatigue. All structures experience fatigue as they are repeatedly exposed to adequate levels of stress. This fatigue accumulates over time as the product continues to experience these stress levels. This accumulation of fatigue is known as Miner’s Rule of Damage. The total damage a product experiences in a particular time period can be calculated from field data PSD (energy of vibration test) and plotted for a specific range of frequencies. The resulting plot of fatigue damage versus frequency is the Fatigue Damage Spectrum (FDS).
The FDS is a helpful visualization tool that communicates to the test engineer the kind of fatigue damage a particular product will experience in the field. Since increasing the kurtosis value of a random vibration test increases the number of peak accelerations in the test, the FDS should show an increase across the frequency spectrum when the kurtosis is increased. Therefore, the FDS is helpful in visualizing how increasing the kurtosis of a test will bring a product to failure more quickly.
The Fatigue Damage Spectrum
1. Calculating the Fatigue Damage Spectrum
The Fatigue Damage Spectrum is produced by plotting the individually calculated fatigue damage values for narrow frequency bands. For example, the PSD data from a particular test is run through a narrowband filter. A specialized calculation tool is used to determine the fatigue damage for the data filtered for each frequency band. This fatigue damage value is plotted. The collective plot of all of these fatigue damage values is the Fatigue Damage Spectrum.
For this particular study, pre-written calculation tools found in MATLAB’s WAFO toolbox were utilized. “WAFO (Wave Analysis for Fatigue and Oceanography) is a toolbox of Matlab routines for statistical analysis and simulation of random waves and random loads… (T)he toolbox contains a number of procedures of the prime importance for mechanical engineers working in the areas of random loads as well as damage and fatigue analysis.”12 These procedures and calculation tools are commonly used in the industry to determine the fatigue damage for data sets.1,4,7, 8 The basis for these calculations is the “rainflow cycle count” and the “Palmgren-Miner damage calculation”. The description and explanation of these concepts is beyond the scope of this paper, but the reader can consult other studies for more details on these matters.1,2,7, 8, 12.
Henderson-Piersol and others suggest that fatigue is directly related to velocity, not acceleration or displacement, and therefore a velocity-based data set must be used to produce a FDS.3,6 Therefore, to match the Henderson-Piersol’s Potential Damage Spectrum (a commonly used tool to illustrate the fatigue of a product) the original acceleration-based data sets in this study were converted into velocity-based data sets. Then the pre-written WAFO calculation tools were weaved into a unique script that took the various PSD data sets and calculated the Fatigue Damage Spectrum and made it closely match the Henderson-Piersol DPS. The procedure used in this study to produce a Fatigue Damage Spectrum is further validated by the procedures utilized by MIL-STD-810F.13
To illustrate that our method of producing a FDS, which utilized WAFO scripts, was valid, we compared our FDS to the Henderson-Piersol DPS for the same data set. As can be seen from figure 2, the two methods produced the exactly same FDS. Consequently, the method we employed is a valid technique. However, the Henderson-Piersol DPS is only valid for Gaussian data sets (see figure 3).6 Since real data is often Non-Gaussian, the Fatigue Damage Spectrum produced using WAFO routines and pre-written calculations is utilized in this study.
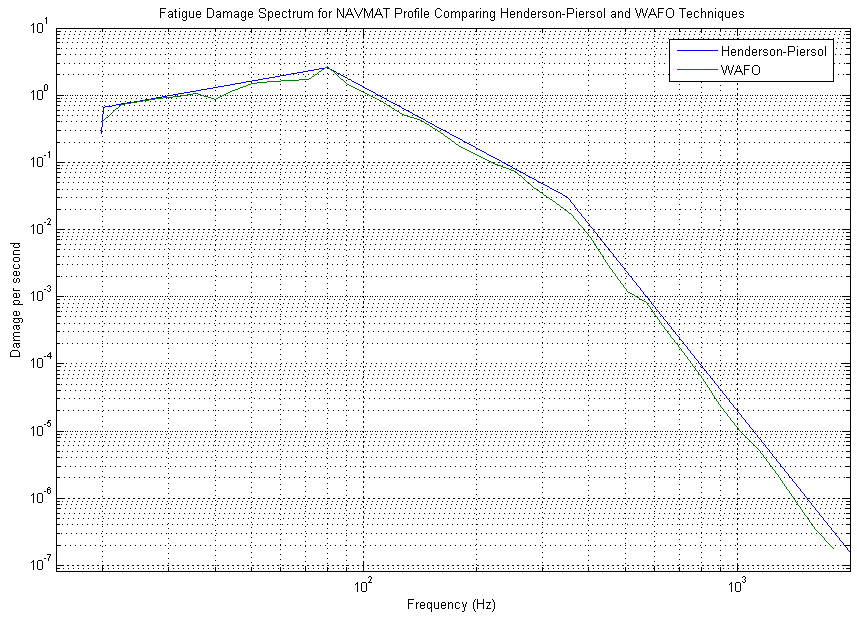
Figure 2: Henderson-Piersol DPS and MATLAB’s WAFO FDS compared.
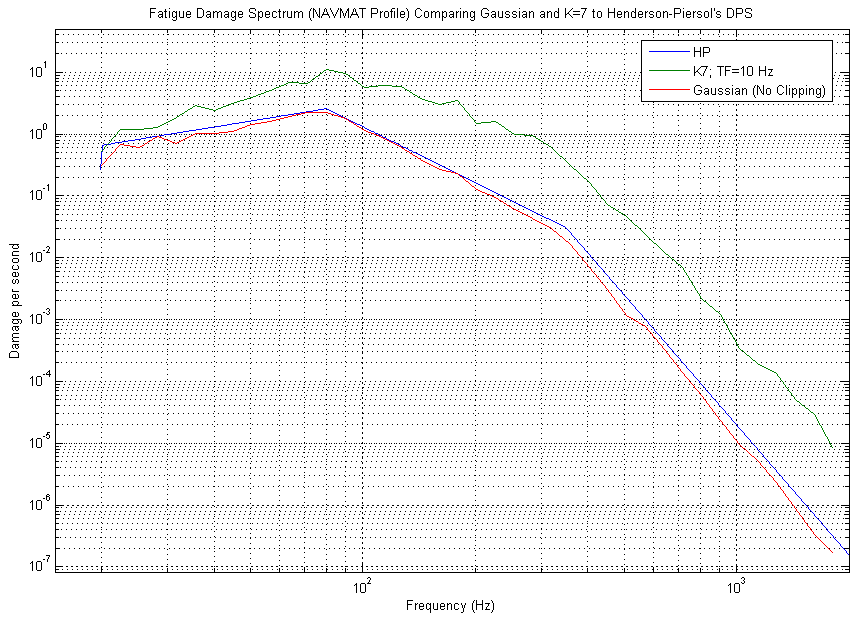
Figure 3: Fatigue Damage Spectrum Comparing Gaussian to Henderson-Piersol’s DPS and K=7 to Henderson-Piersol’s DPS for the same NAVMAT profile. Notice that the Henderson-Piersol DPS for the NAVMAT profile only produces Gaussian fatigue levels, while WAFO FDS can produce higher kurtosis level fatigue.
The Relationship Between Fatigue Damage Spectra and Kurtosis
Since Kurtosis Control is such an effective means to reduce the test-time of a product, it was considered beneficial to show that a proper Kurtosis Control algorithm will increase the fatigue damage that a product experiences. In order to illustrate the relationship between the Fatigue Damage Spectrum and the kurtosis level of a test, the following study was conducted.
1. Effect of Increasing Kurtosis on Fatigue
Kurtosis Control techniques increase the number of large acceleration peaks in the random vibration test while maintaining the same RMS values and the same PSD. Therefore, the test contains the same amount of energy as a typical Gaussian random vibration test, but does so by taking some of the “average” peak accelerations and converting some of them to peak accelerations and others to minimal accelerations. Therefore, the total energy of the test remains the same, while increasing the number of peak accelerations.
Therefore, by increasing the kurtosis parameter the test engineer can increase the number of peak accelerations in the test. These peak accelerations are the accelerations that are primarily responsible for the damage that a product experiences in the field. Hence, by increasing the kurtosis value the test engineer can expose a test item to more damage or more fatigue.
To illustrate that this is the case, a series of simulated tests were conducted at various kurtosis values and FDS plots were created from these different tests. The results clearly show that as the kurtosis values increase the amount of fatigue the product experiences also increases (see figure 4).
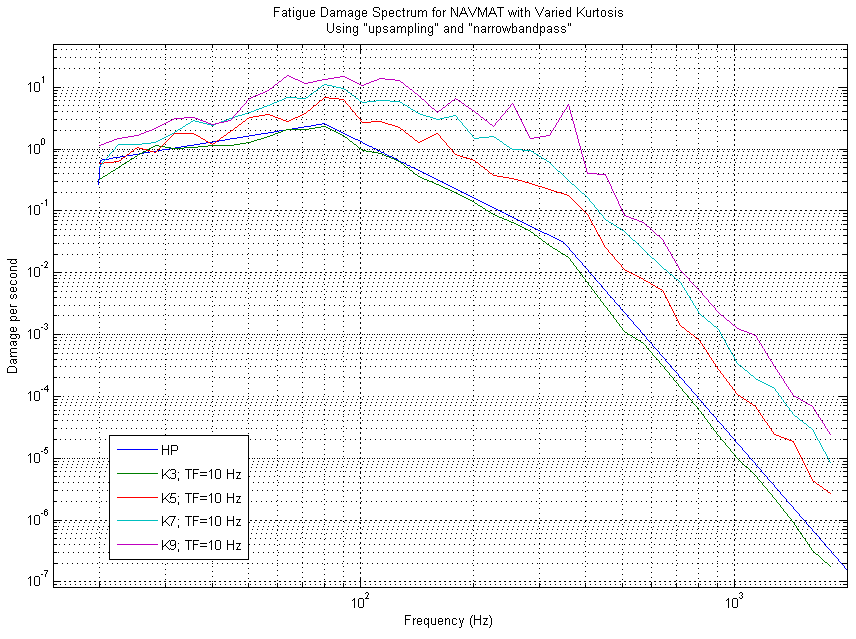
Figure 4: FDS for Simulated NAVMAT at various kurtosis values
In addition, note how figure 4 illustrates that the kurtosis value is an important parameter in determining the amount of fatigue damage a product will experience. Traditional random vibration tests produce Gaussian (kurtosis=3) data distribution. Figure 4 shows that increasing the kurtosis level above the traditional Gaussian random vibration test level will increase the damage a product experiences across the entire frequency spectrum. Consequently, random vibration tests with increased kurtosis will bring more damage to the product and shorten its time-to-failure.
2. Effect of Decreasing Transition Frequency on Fatigue
Although Kurtosis Control is fairly new to random vibration testing, there are a variety of techniques or methods being utilized today. As has been shown in other presentations, these different kurtosis control techniques are not all equally effective in increasing the peak accelerations at all frequencies – particularly, not all techniques are effective in getting the kurtosis into the resonances.9 How can test engineers ensure that the kurtosis control technique they use is capable of increasing the peak accelerations in all frequencies? Since the FDS displays the fatigue damage across the frequency spectrum, a valid kurtosis control technique should show an increased FDS across the entire frequency spectrum.
Some kurtosis control techniques are capable of getting the kurtosis to affect the data at high frequencies, but fail to be effective at lower frequencies. The FDS plot becomes an effective tool for evaluating the effectiveness of a kurtosis control method at this point. Figure 5 shows how some methods produce increased fatigue damage at the higher frequencies, but are unable to sustain the increased fatigue damage levels at the lower frequencies. However, a valid kurtosis control algorithm will cause an increase in fatigue damage across the entire frequency spectrum. This is accomplished by decreasing the transition frequency parameter, as seen in figure 5.
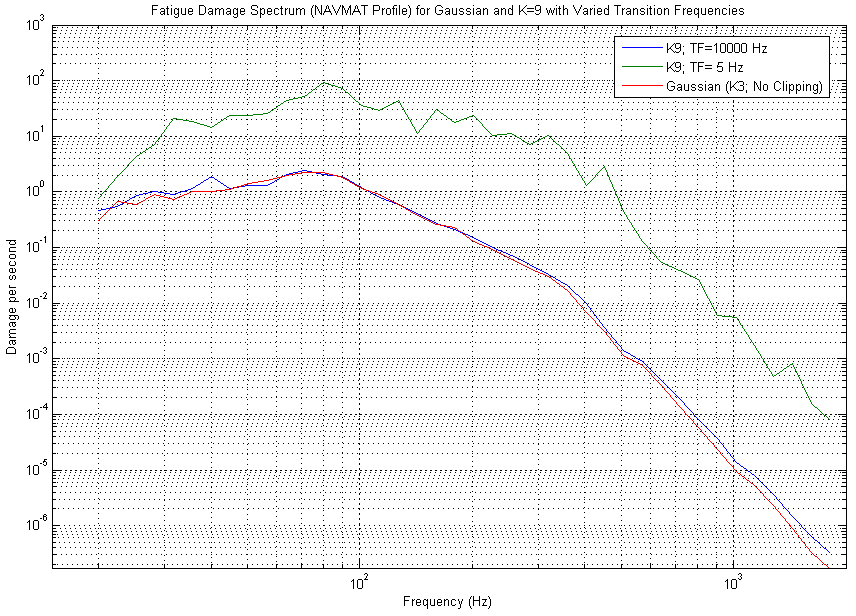
Figure 5: Fatigue Damage Spectrum for NAVMAT profile of Gaussian and K=9 with different Transition Frequencies. Notice how the K=9; TF=10,000Hz is ineffective. It produces almost the same fatigue as Gaussian distribution. However, K=9; TF=5Hz is highly effective. The fatigue damage increases by a factor of 100 across the entire frequency spectrum.
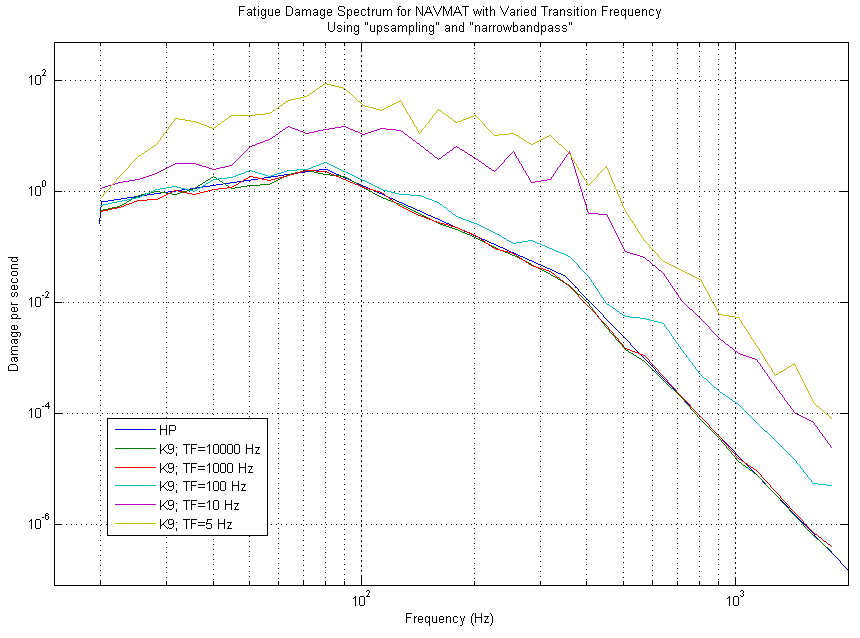
Figure 6: The FDS for a simulated NAVMAT test of K=7 with varied Transition Frequencies. Note how the higher Transition Frequency tests were only effective at the higher frequencies, but not across the entire frequency spectrum.
The key kurtosis control parameter to achieving the increased fatigue damage across the frequency spectrum is the transition frequency. In figure 6, the fatigue damage plots that remained at an increased level across the entire frequency spectrum were those whose transition frequency had been lowered.
Illustrating the Relationship Between Kurtosis and the Fatigue Damage Spectrum
1. Light Bulb Test Demonstration
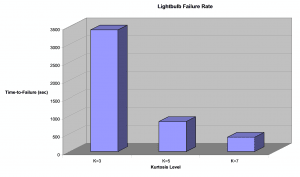
Figure 7: Mean Time-to-Failure (sec) of 75 Watt Lightbulbs vs. Kurtosis Level
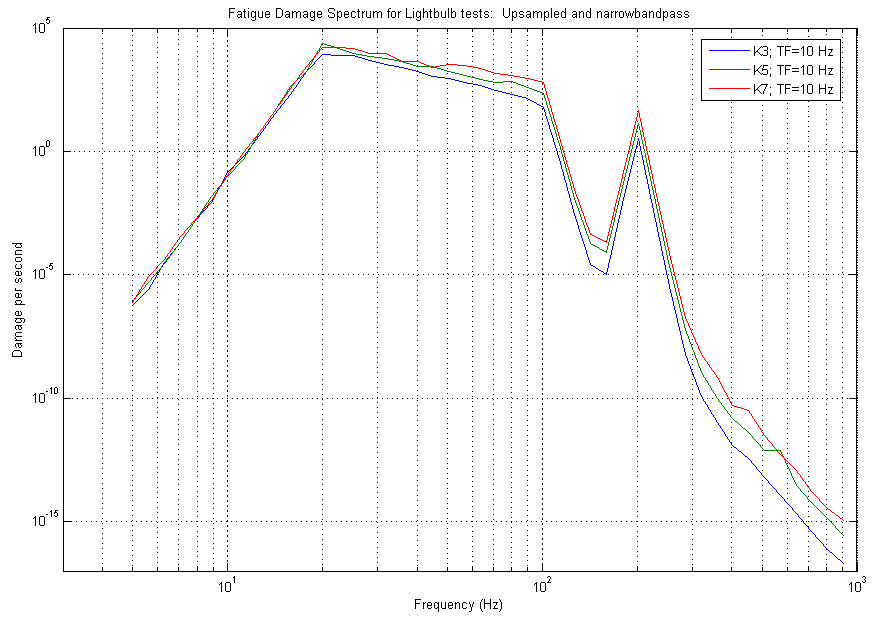
Figure 8: FDS for Light bulb data at various kurtosis values
In previous studies, we have shown how increasing kurtosis led to faster light bulb failure in our 2005 light bulb case study. In that study we discovered that the same brand of 75 watt light bulbs would experience filament failure at faster times for increasing kurtosis values. In that study, light bulbs tested at kurtosis = 3 failed at an average time of 56.2 minutes (3,400 sec), while kurtosis = 5 failed at an average time of 14 minutes (840 sec) and kurtosis = 7 failed at an average time of 6.7 minutes (400 sec) (See figure 7).
Those same test profiles at those same kurtosis values were used to calculate a FDS using the MATLAB scripts in the WAFO toolbox. The following graph was produced, showing that by increasing the kurtosis of a test, the fatigue that the product experiences also increases (see figure 8).
Using the 2005 study’s time-to-failure (3,400 sec) for the K=3 data set (Transition Frequency = 10,000Hz) and the damage per second at 806Hz (7.49 X 10⁻¹⁷ damage/sec), a total fatigue damage-at-failure number for that frequency can be determined (2.55 X 10⁻¹³ damage-at-failure). Using this number for the other kurtosis trials and their particular damage per sec at 806Hz, it is possible to calculate a theoretical time-to-failure for the other trials (See Table 1 for theoretical time-to-failures and Figure 9 for a comparison).
|
K3 (SECONDS) |
K5 (SECONDS) |
K7 (SECONDS) |
|
|
Original (actual) |
3,400 |
840 |
400 |
|
TF = 1000Hz |
* |
1,050 |
436 |
|
TF = 100Hz |
* |
945 |
337 |
|
TF = 10Hz |
* |
190 |
77 |
Table 1: Actual data and theorized values with varying kurtosis and transition frequency.
*The original data for K3 time-to-failure was used as basis to calculate the K5 and K7 time-to-failure for the other trials. Therefore, there is no calculated theoretical time-to-failure for the K3 trials with varying transition frequencies.
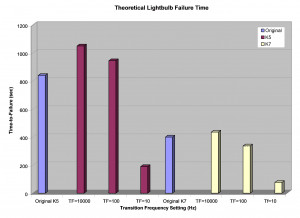
Figure 9: Comparison of original time-to-failure data and theoretical time-to-failure data at different transition frequency levels for both Kurtosis 5 and Kurtosis 7.
The plot and table illustrate important relationships between the kurtosis value and the fatigue damage. First of all, this part of the study shows that an accurate Fatigue Damage Spectrum can be produced for particular kurtosis values. This is shown by the fact that the theoretical time-to-failures for the Transition Frequency = 10,000Hz data set produced very similar time-to-failure as the original 2005 light bulb study results.
Secondly, as the transition frequency decreases the fatigue levels increase. This corresponded to shorter theoretical time-to-failures for the light bulb tests. This clearly shows that by using a proper kurtosis control algorithm that can adjust the transition frequency, the lower transition frequency settings will produce greater fatigue damage on the product, and thereby, bring the product to failure faster.
Finally, this study illustrates that the Fatigue Damage Spectrum is a helpful tool to assist the test engineer in designing a test for a particular product. It helps ensure that the kurtosis control algorithm is actually effective, shown by an increase in fatigue damage across the frequency spectrum.
Note that the correlation between the Fatigue Damage Spectrum and the kurtosis level may permit engineers the opportunity to create new parameters that will allow the test engineer to “dial-in” the amount of fatigue damage found on the field for a particular product and the desired time to test the product. The software could “set” the appropriate kurtosis level and transition frequency to bring the product to the desired fatigue level in the desired time frame.
Conclusions
The Fatigue Damage Spectrum is a valuable tool in evaluating the effectiveness of a kurtosis control technique. Valid kurtosis control techniques must show an increase in the FDS plot across the entire frequency spectrum. The key kurtosis control parameter to cause the necessary increase in the FDS plot across the entire frequency spectrum is the transition frequency. Low level transition frequencies are more effective than high level transition frequencies in making the kurtosis control effective at the lower frequency ranges. The FDS plot corresponds well to the time-to-failure of products. By increasing the kurtosis and using lower transition frequencies, the test engineer can bring an increased fatigue damage and shorter test time to the product under test. These results have several implications for test engineers:
- Test engineers using kurtosis control should plot the FDS of their original data set and the kurtosis controlled data set. Effective kurtosis control techniques will have an increased FDS across the entire frequency spectrum
- Test engineers should set the transition frequency parameter of their kurtosis control technique to low values (less than the bandwidth of the resonances in the test) so that the kurtosis is applied across the entire frequency spectrum, shown by an increased FDS across the spectrum.
- Test engineers can greatly decrease their test times by computing a total fatigue damage value for their product’s test and creating a higher kurtosis test that produces the same total fatigue damage value.
In summary, Vibration Research Corporation’s patented Kurtosion® technique can get the kurtosis across the entire frequency range of a spectrum by adjusting its unique transition frequency parameter. By utilizing a FDS the test engineer can confirm that Kurtosion is an effective kurtosis control technique. Finally, by using the FDS and a total fatigue damage value the test engineer can program a test to decrease a product’s testing time. With Kurtosion and FDS, random vibration testing is all the more effective and realistic.