Earthquake Test Reporting
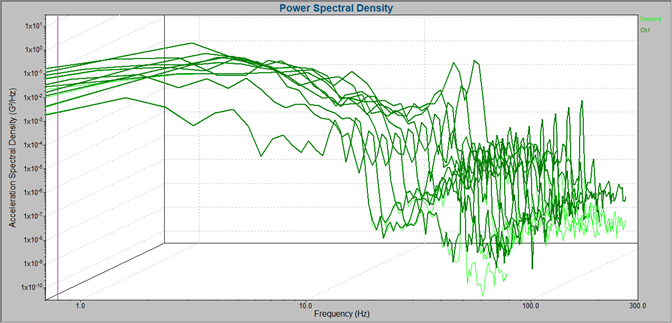
IEEE/IEC 60980-344 and similar standards require several plots and calculations in the test report. The Earthquake module in VibrationVIEW generates reports specific to IEEE 344 earthquake testing, including:
- Coherence plot
- Correlation plot
- Waterfall plot (stationarity) with RMIN and RMAX calculations
- Peak stress cycle counting
IEEE 344 Standard
IEEE/IEC 60980-344 defines the procedures that demonstrate that Class 1E equipment can perform during a seismic event. Nuclear Class 1E includes the electric, safety-related equipment and systems essential to an emergency shutdown prompted by an event such as an earthquake.
The IEEE 344 test standard simulates multiple seismic events and is applicable to electric, instrumentation and control, and mechanical equipment.
Shock Testing
The Earthquake module requires the VibrationVIEW Shock module. With the Shock software, engineers can perform closed-loop control of transient waveforms, selecting from industry-standard pulse shapes or a user-defined transient pulse.
Advanced Shock Testing Software
Custom Reporting
The Earthquake module includes reporting parameters for IEEE 344, but VibrationVIEW’s custom reporting makes it easy to create a report template for other specifications.
With custom reports, engineers can define the included parameters to adhere to test standards or customer requests. They can also add other details such as data vectors, graphs, screen images, test notes, and company branding.
Additional Earthquake Standards
- AASME NQA-1
- AC-156
- Bellcore (Telcordia) GR-63
- CAN3-N289.4-M86
- IEEE 382
|
- IEEE 693
- ICC-ES AC 156
- ISO 4866.2010
- ISO/TS 10811-1:2000
- QME-100
|
Fulfill Seismic Test Specifications
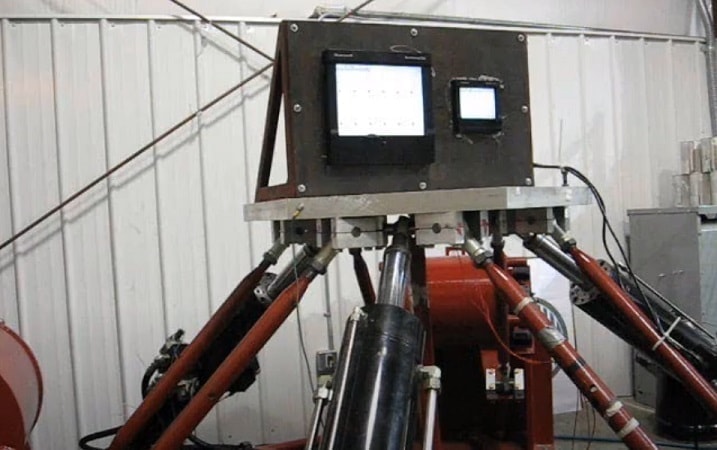
 Structures and equipment installed in seismically active regions must be designed to protect the operating equipment in the event of an earthquake. With the VR control hardware, perform single-axis/multi-axis earthquake testing that meets test standards using a test template or user-defined time transient.
Seismic Industry
Earthquake Testing Live
Multi-Axis Control
The VR10500 can control multi-shaker systems, including electrodynamic, servo-electric, and servo-hydraulic systems. Available multi-shaker control options include multi-loop with phase control, 3-axis (x-y-z) control, 4-post control, and earthquake controls.
Link Multi-Axis Servo Control
Kokusai Multi-Axis Control